")
")
")

| Methods - Beyond Reasonable Doubt - designing your own experiments, the basics |
 |
 |
 |
| ??????????? - Basics | |||
| Автор: NHA | |||
| 22.09.2012 11:00 | |||
|
Tags NHAR 3 - experiments - testing - proving - theory - hypothesis - correlation - practical science There are no translations available.
Beyond Reasonable Doubt Setting up research experiments -the basics
First you decide what you want to find out. You form an hypothesis, which is your educated guess about your particular problem or idea, and then work to support it and prove that it is correct, or refute it and prove that it is wrong (either will reveal some truth). Example: Suppose that Popeye the sailor man wonders whether he can run a marathon faster when he eats twice as much spinach the night before the race. His hunch is that loading up on spinach might give him the energy to run faster the next day. Popeye's hypothesis would be something like, "The time it takes me to run a marathon will be improved when consuming large quantities of the slow-release (low GI) carbohydrate spinach, 12 hours pre-race." His null hypothesis is the opposite: "The time it takes me to run a marathon will NOT be improved when consuming large quantities of the slow-release (low GI) carbohydrate spinach, 12 hours pre-race." Notice we say 'when consuming' and not 'by consuming', This experiment is looking into correlation, not cause and effect, because no single experiment can determine causality (see below). Popeye will have to tighten this up a bit by defining 'large quantities' in precise figures.
A well-designed experiment needs to have an independent variable and a dependent variable. The independent variable is what the scientist manipulates in the experiment. The dependent variable changes based on how the independent variable is manipulated. Therefore, the dependent variable provides the data for the experiment. In our example: The independent variable is “the consumption of spinach”, and the dependent variable is “how fast Popeye runs the race”. Experiments can have only one independent variable. For example, if Popeye ate several bowls of spinach the night before the race, but then got up the next morning and drank an extra cup of coffee before heading to the start line, his experiment is useless. By drinking the extra coffee, he introduced a second independent variable, so he will not know whether the faster race time is due to the spinach or the coffee. If he wants to know the effect of caffeine (or extra sleep or improved training) on his race time, he would have to design a second (or third or fourth) experiment. You need lots of data. The experiment would have to be performed many times with the same variables to demonstrate any valid statistical significance for Popeye (and results still cannot be extrapolated to other people, because everybody's different).
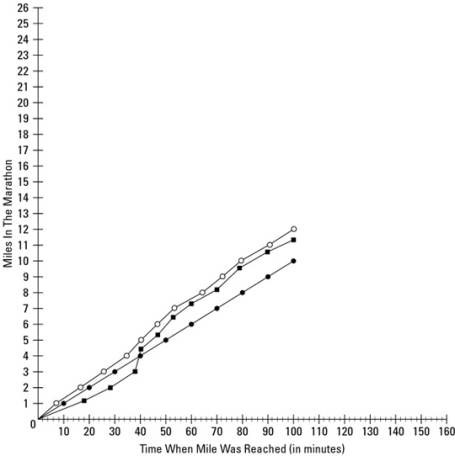
Once you have enough data you can graph it for a visual comparison of results from two or more experiments. In our example, comparing the time it took to run a marathon after eating spinach the night before, getting extra sleep, drinking extra coffee, or whatever other independent variable Popeye may want to try, distance (miles 1 to 26) would be labeled up the y-axis. (A factor that does not change in all the experiments is that a marathon is 26 miles long. This is a 'fixed' variable). Time would be plotted along the x-axis. The lines that emerge on the graph give you the time it took for Popeye to reach each mile. This data might vary based on what Popeye changed before the race, such as diet, sleep, or training. You can plot several independent variables on the same graph by using different colors or different styles of lines. Popeye's graph might look something like the example below:
Graph showing the time each mile of a marathon was reached for Popeye when he consumed spinach (white circles line), when he consumed extra coffee (squares line), and when he slept four extra hours prior to the race (black circles line).
Experiments need a control. All Popeye knows from this graph is his speed on various substances. How would he know if his race times were improved from 'normal' either by eating spinach or drinking extra coffee? He would have to run a marathon without eating spinach the night before or drinking extra coffee the morning of the race. This is his control experiment. (Otherwise, results can't be compared to anything and he would have no idea if his performance was better, worse, or the same.) It's useful to do the control experiment first if you have only one subject.
So whatever your experiment is, you start it by answering these questions: What's the hypothesis? What's the null hypothesis? What's my independent variable? What's my dependent variable? What am I going to do for 'control'? How am I going to record the data? Graphs, tables, diagrams, which is best for this?
Then you gotta draw conclusions from your results, (remember that errors must be reported) and write up a paper telling us all about it. Have fun! But in drawing your conclusions be careful not to fall into the mistakes below:
Mistaking correlation for cause and effect Popeye cannot claim that 'spinach makes me run faster'. He can only claim that race time improves when spinach is eaten. This does not mean that spinach CAUSES him to run faster, only that the two factors are correlated. Popeye would have to do loads of experiments to prove that this happened every time in all sorts of different contexts, and explore other possibilities such as eating cabbages (it might be that spinach only works at night, only works for male sailors who smoke pipes, or that ALL green food correlates with better performance; we don't yet know). If Popeye wants to prove causation, he needs a LOT more data.
Extrapolating from one example to many without proof Popeye cannot claim that 'spinach makes people run faster'. He hasn't tested everyone, only himself. He would have to test a large number of people and report what percentage of them found race time improved. If 100% of subjects got improved times, then he could upgrade his hypothesis to a theory (an hypothesis backed by proof).
If over a long time everybody else got the same results, then we could tentatively say that this theory appears to be a fact.
|
|||
| Обновлено 02.08.2013 13:38 |